Louisville vs. SMU
Summary
Louisville knocked off SMU with a +10 point differential. They tallied up 41 points compared with SMU’s 31 points. The Cardinals outscored the Mustangs 14-7 in the 1st quarter but ended up going 0-10 in the 2nd quarter. Louisville maintained the edge through the second half, going 14-7 in the third quarter and 13-7 in the fourth quarter.
Major Stat Lines
SMU was up +37 in the overall yardage category, logging 442 yards of offense compared with Louisville’s 479 yards.
Most of SMU’s yardage advantage and major mishaps came on the passing side of things. They were +45 in yards earned through the air, posting 222 passing yards compared with Louisville’s 177 passing yards.
- Louisville went 61% on 23 pass attempts with zero interceptions thrown.
- SMU went 68% on 35 attempts with two interceptions thrown.
Louisville finished the game with a +8 rushing advantage. Cardinals’ rushers tallied up 265 rushing yards, barely edging out the Mustangs 257 rushing yards.
- Louisville closed out with 37 total rush attempts and averaged 7.2 yards per attempt.
- SMU closed out with 45 total carries and averaged 5.7 yards per carry.
| Louisville | SMU | |
| Total Yards | 442 | 479 |
| Passing Yards | 177 | 222 |
| Rushing Yards | 265 | 257 |
Impact Players
Both teams’ quarterbacks had major impacts throughout the game.
- Louisville’s junior QB, Lincoln Kienholz, completed 14 of his 23 pass attempts for 177 yards and two touchdowns.
- SMU’s senior QB, Kevin Jennings, went 24 of 35 for 222 yards, one touchdown and the team’s two interceptions.
The running backs were major stars in the Week 3 Louisville vs. SMU matchup.
- SMU’s senior running back, Kendrick Raphael, walked away from Week 3 with 24 rush attempts for 197 yards and an average of 8.2 yards per carry. He also logged all three of the Mustang’s rushing touchdowns.
- Louisville’s senior running back, Keyjaun Brown, finished the game with ten carries, 163 yards and an unprecedented 16.3 earned on average per carry. Brown was also responsible for two of the team’s four touchdowns earned on the ground.
Nerd Profile
| Louisville | SMU | |
| Region | Louisville–Jefferson | Dallas–Fort Worth–Arlington |
| Regional Population | 1,402,509 | 8,477,157 |
| County | Jefferson | Dallas |
| County GDP | $62,385,959 | $311,747,303 |
Rutgers vs. USC
Summary
USC made the cross-country journey to New Jersey and pulled off a slim +7 win over Rutgers. The Trojans out earned the Scarlet Knights 10-7 in both the first and second quarters. Rutgers started their comeback in the third quarter, putting up 14 points while USC tacked on another 15 points. The teams went 7-7 in the fourth quarter, which locked in the USC victory.
Major Stat Lines
USC was only +1 in total offensive yards against Rutgers, with the breakdown being 461 for the Trojans and 460 for the Scarlet Knights.
Rutgers had the +15 passing advantage along with some significant mistakes, logging 292 passing yards compared with the Trojans’ 277 yards earned through the air.
- Rutgers was 51% on 37 pass attempts with two interceptions thrown.
- USC was 62% on 32 pass attempts with zero interceptions thrown.
USC had the +16 rushing advantage. The Trojans finished the game with 184 rushing yards and Rutgers had 168 rushing yards.
- Rutgers closed out their loss with 32 rush attempts and 5.5 yards earned per carry.
- USC closed out their win with 31 carries and 5.9 yards earned per carry.
| Rutgers | USC | |
| Total Yards | 460 | 461 |
| Passing Yards | 292 | 277 |
| Rushing Yards | 168 | 184 |
Impact Players
USC’s senior quarterback, Jayden Maiava, had the best overall day. He went 20 for 32 and tallied up 277 passing yards with two touchdown passes.
Rutger’s senior quarterback, Dylan Lonergan, walked away having competed 18 of his 26 attempts for 252 yards and three touchdowns. But that positive production was offset by two interceptions.
Junior running back for Rutgers, Antwan Raymond, had 21 rush attempts for 122 yards, averaging 5.8 yards per attempt and one rushing touchdown.
The Trojans’ sophomore running back, King Miller, logged 102 yards on 16 carries. He averaged 6.4 yards per carry and also claimed one rushing touchdown.
Nerd Profile
| Rutgers | USC | |
| Region | Boston-Cambridge-Newton, MA-NH | Los Angeles–Long Beach–Anaheim |
| Regional Population | 5,034,221 | 12,844,441 |
| County | Middlesex | Los Angeles |
| County GDP | $70,024,451 | $810,842,127 |
Kentucky vs. Texas A&M
Summary
Kentucky delivered one of the weekend’s biggest college football upsets, with a +10 win over Texas A&M. Neither team put up points in the first quarter and they went 7-7 in the second quarter. Kentucky came out of half time charged up and shutout A&M 21-0 in the third quarter. The Aggies rallied, outscoring the Wildcats 14-3 in the fourth quarter but it wasn’t enough and the final score was 31-21 in Kentucky’s favor.
Major Stat Lines
Despite the loss, Texas A&M had the overall, +15, yardage advantage. They closed out Week 3 with 423 yards of total offense, compared with Kentucky’s 408 yards of total offense.
Kentucky’s yardage advantage fell in the passing category. They were +16, logging 252 yards through the air while Texas A&M tallied up 236 passing yards.
- Kentucky went 78% on 18 pass attempts with zero interceptions thrown.
- Texas A&M went 53% on an overwhelming 49 pass attempts with two interceptions thrown.
The Aggies were +31 in rushing yards, earning 187 yards on the ground compared with the Wildcat’s 156 rushing yards.
- Kentucky finished the game with 36 carries and 4.3 yards earned per carry.
- Texas A&M finished the game with 35 rush attempts and an average of 5.3 yards earned per attempt.
| Kentucky | Texas A&M | |
| Total Yards | 408 | 423 |
| Passing Yards | 252 | 236 |
| Rushing Yards | 156 | 187 |
Impact Players
Kentucky’s senior quarterback, Kenny Minchey, was the game’s star quarterback. The transfer QB from Notre Dame walked away from the Week 3 win with 14 of his 18 passes completed, 252 passing yards and two touchdown passes.
Texas A&M’s quarterback, Marcel Reed, rushed logged 10 carries, 80 rushing yards, an average of 8 yards per carry and one rushing touchdown.
Aggie junior wide receiver, Mario Craver, closed out the action with 11 catches for 119 yards.
Nerd Profile
| Kentucky | Texas A&M | |
| Region | Lexington-Fayette | College Station–Bryan |
| Regional Population | 535,174 | 287,476 |
| County | Fayette | Brazos |
| County GDP | $22,665,840 | $12,496,050 |
LSU vs. Ole Miss
Summary
Ole Miss pulled off a win in one of the season’s most anticipated matchups. LSU traveled to Oxford Mississippi and were bested by the home team, 32-24. Ole Miss shut out the Tigers 10-0 in the first quarter and added on more damage with a 14-7 performance in the second quarter. LSU turned the table with a 14-0 third quarter but Ole Miss locked in the +8 win with a 8-3 fourth quarter performance.
Major Stat Lines
Ole Miss had a +96 overall yardage advantage in the victory. They put up 426 yards, compared with LSU’s 330 yards of total offense.
The bulk of Ole Miss’s success came from their passing attack. They were +205 in the category, logging 363 passing yards compared with the 158 yards LSU had tallied up by the final whistle.
- LSU went 59% on 27 pass attempts with one interception thrown.
- Ole Miss went 69% on 48 pass attempts with one interception thrown.
LSU had a size-able +109 rushing advantage. The Tigers logged 172 yards on the ground, compared with Ole Miss’s 63 rushing yards.
- LSU finished their Week 3 loss with 43 carries and an average of 4 yards per carry.
- Ole Miss finished their Week 3 win with 25 carries and an average of 2.5 yards per carry.
| LSU | Ole Miss | |
| Total Yards | 330 | 426 |
| Passing Yards | 158 | 363 |
| Rushing Yards | 172 | 63 |
Impact Players
Ole Miss quarterback Trinidad Chambliss had a standout performance in the highly watched game. He completed 33 of his 48 pass attempts for 363 yards. Chambliss threw two touchdown passes and one interception.
LSU’s sophomore running back, Dilin Jones, wrapped up the game with 23 rush attempts, 106 yards on the ground, 4.6 yards per carry and one rushing touchdown.
Ole Miss junior wide receiver Traylon Ray, logged 115 receiving yards on seven catches, including one touchdown catch.
Nerd Profile
| LSU | Ole Miss | |
| Region | Baton Rouge | Oxford |
| Regional Population | 888,699 | 71,972 |
| County | East Baton Rouge | Lafayette |
| County GDP | $37,162,731 | $2,463,311 |
SEC
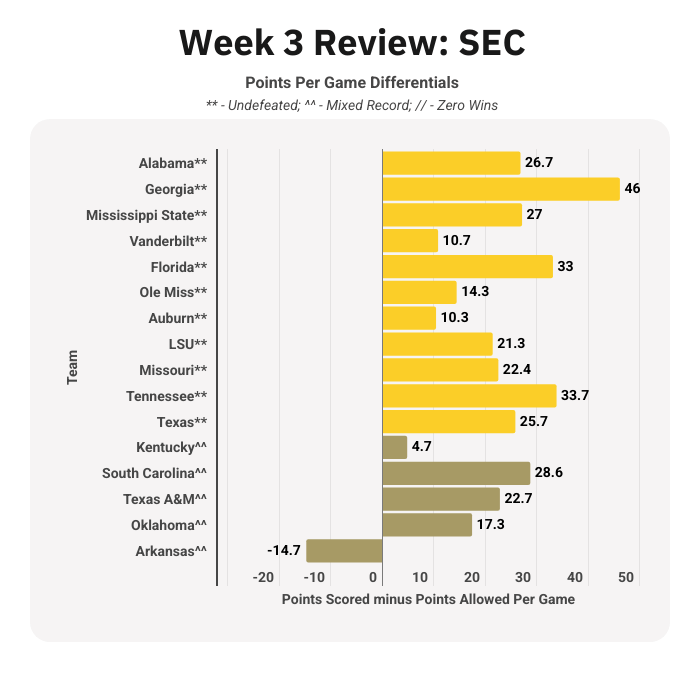
The SEC has the largest share of its member remaining undefeated coming out of Week 3. Eleven of the Power 4 conference’s members haven’t taken a loss yet.
- Kentucky, South Carolina and Texas A&M are all three sitting with 2-1 overall records.
- Oklahoma’s record is 1-1 and Arkansas’ 1-2 overall record is the worst in the conference.
Big Ten
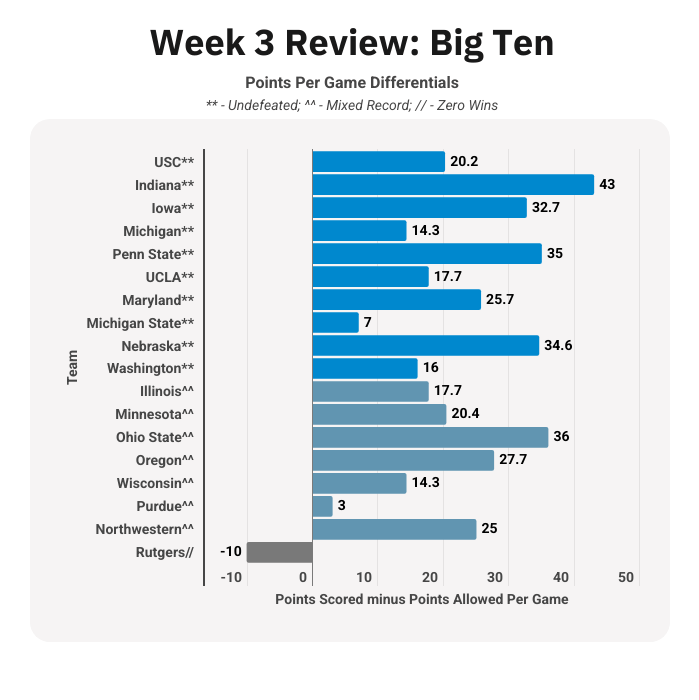
The Big Ten has the second largest share of its member remaining undefeated through three weeks of college football. Ten of the conference’s 18 members have evaded losses.
- Illinois, Minnesota, Ohio State, Oregon and Wisconsin all possess 2-1 overall records.
- Purdue and Northwestern are 0.50 with 1-1 overall records.
- Rutgers is the only Power 4 program yet to find a win through Week 3 and is sitting at an unpleasant 0-3.
Big 12
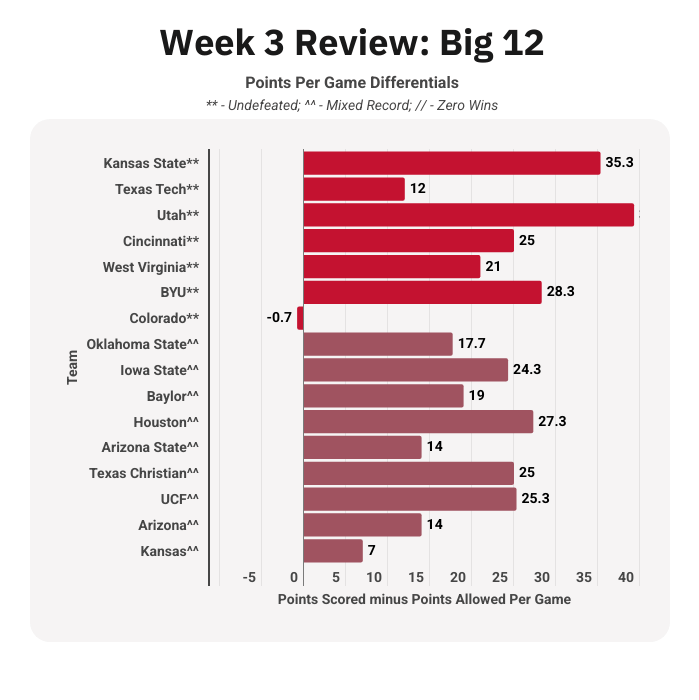
The Big 12 has the third largest share of undefeated membership combing out of Week 3. Seven of the conference’s 16 members have yet to take a loss.
- Oklahoma State, Iowa State, Baylor, Houston and Arizona State all have 2-1 records.
- TCU, UCF and Arizona are 1-1 heading into Week 4.
- Kansas has the worst overall record, 1-2, in the conference.
ACC
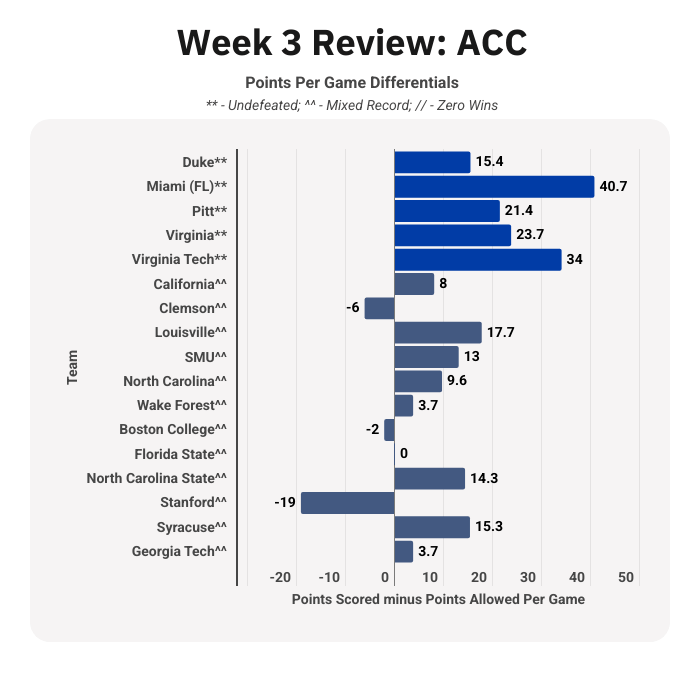
The ACC has the smallest share of undefeated membership heading into Week 4 of the 2026-27 season. Only five of the conference’s 17 members remain unblemished.
- California, Clemson, Louisville, SMU, North Carolina, Wake Forest and Boston College have 2-1 overall records
- Florida State, North Carolina State, Stanford, Syracuse and Georgia Tech are all sitting at 1-2 through Week 3.
 Nerd's Guide to College Football